Skapa infografik online med AI
💡 Beskriv din data eller process som ska visualiseras (t.ex. 'företagets tillväxtstatistik', 'arbetsflöde för marknadsföring', 'tidslinje'). Inkludera syfte och stil: professionell, färgglad eller minimalistisk.
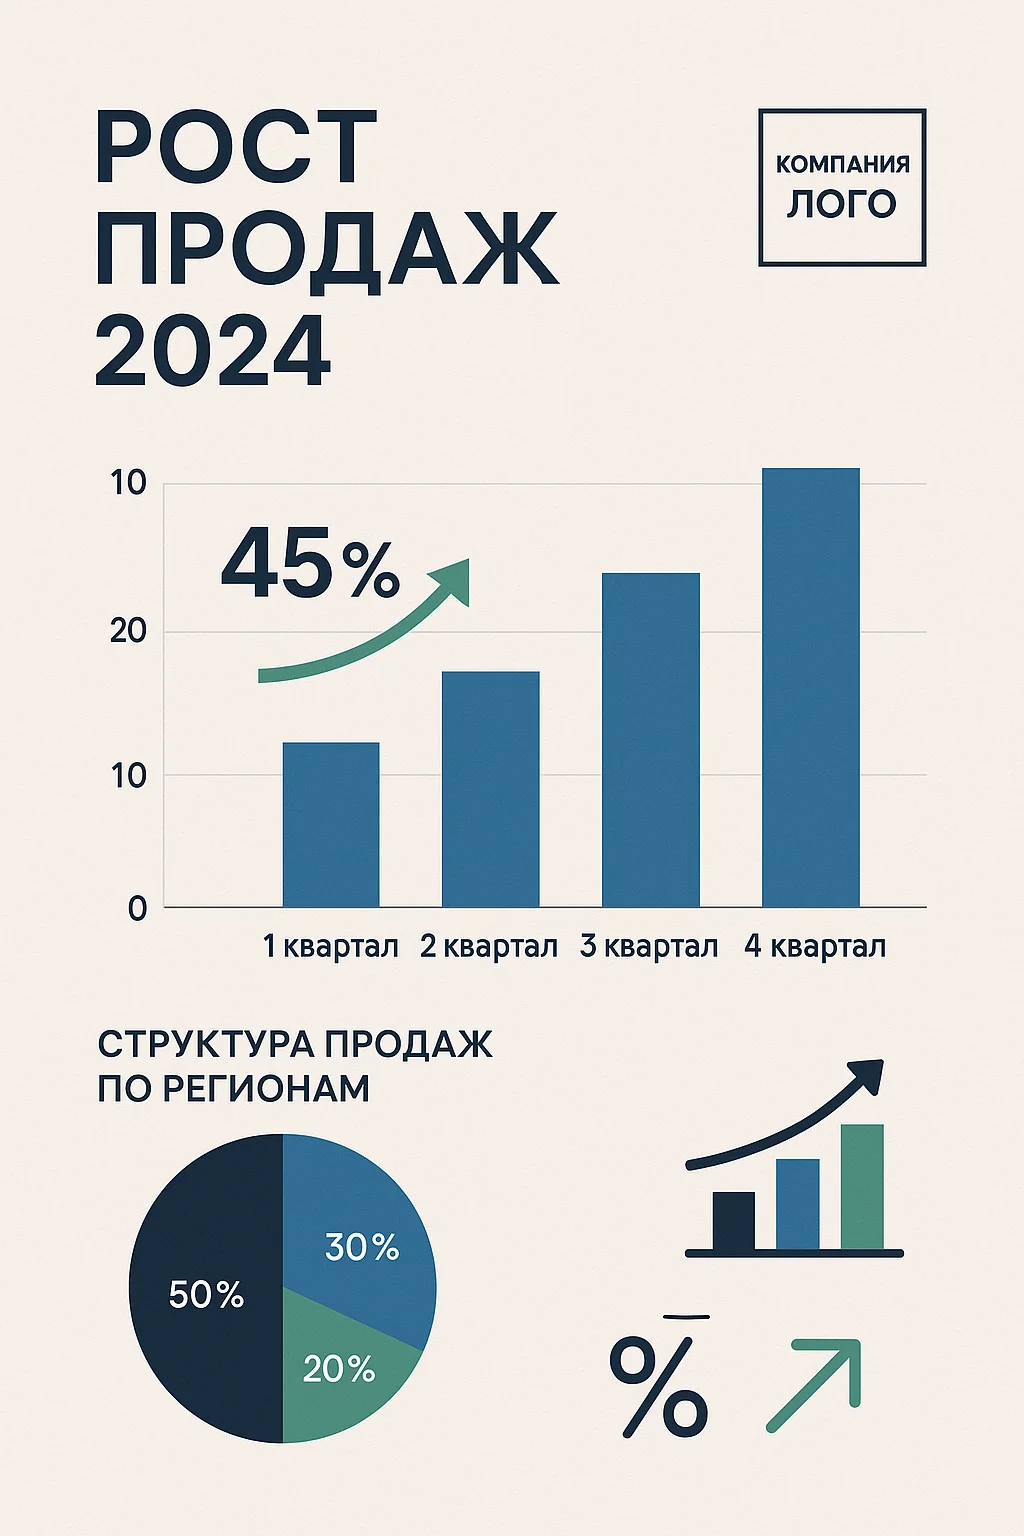
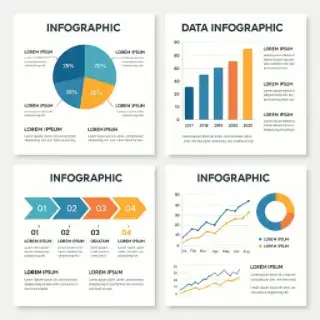
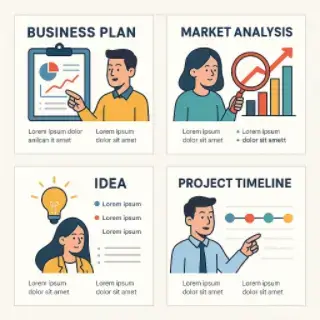
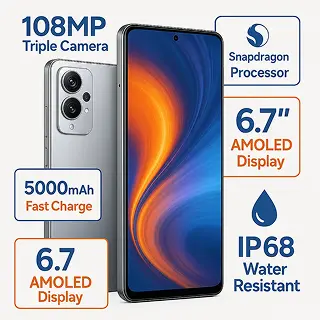
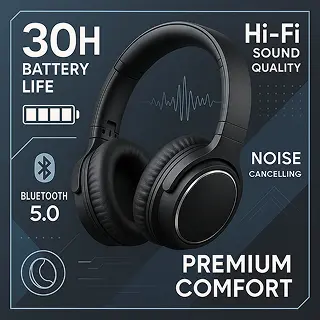
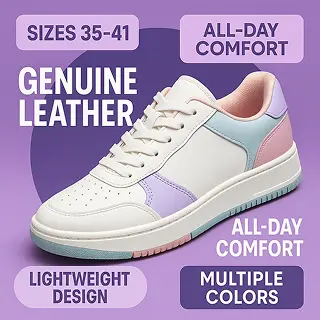
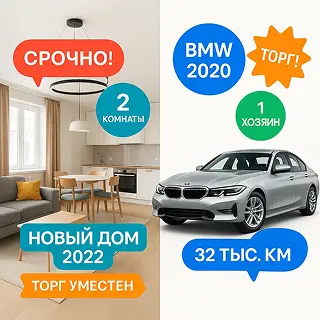
Exempel på skapade bilder


Infografikgenerator för företag, utbildning och marknadsföring
Skapa infografik online med AI för att visualisera data, förklara processer och presentera komplex information på ett engagerande sätt. Generera infografikdesign för företagspresentationer, marknadsföring och utbildningsmaterial med diagram och grafer.
Nyckelfunktioner:
- Infografikdesign för företag, utbildning och marknadsföringspresentationer
- Flera stilar: datadiagram, processflöden, tidslinjer och jämförelsegrafik
- Smart datavisualisering med diagram, grafer, ikoner och visuell hierarki
- Innehållsintegrering optimerad för tydlig informationspresentation
- Högupplöst resultat för presentationer, rapporter och marknadsföringsmaterial
- Flexibel designanpassning för olika plattformar och behov
All AI för bildgenerering

Julkostym på foto med AI

AI Bildgenerator

Skapa 8 mars-kort online med AI

Skapa gudinnebild med AI

AI-generator för 23 februari-kort

Romantiska fotoeffekter med AI för Alla hjärtans dag

AI-generator för Alla hjärtans dag-kort
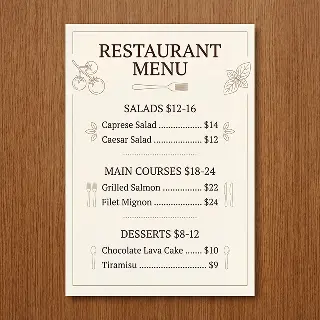
AI-generator för menyer och prislistor
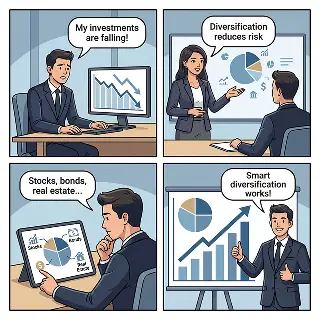
AI-seriegenerator

God morgon-hälsningar med ditt foto
Skapa visitkort online med AI
Skapa flyers online med AI
Skapa affischer online med AI

Skapa inlägg för sociala medier med AI
Skapa företagsmeddelanden med AI
Skapa infografik online med AI
Skapa presentationsbilder online med AI
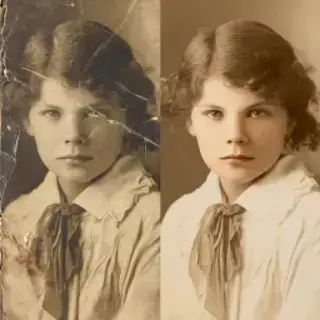
Restaurera gamla foton online med AI

AI-fotogenerator från ditt foto
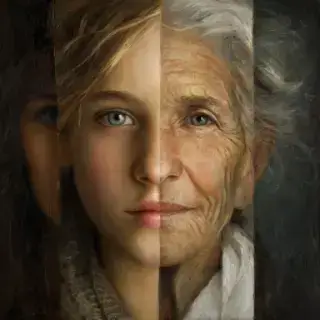
Åldra ansiktet online med AI

AI-fotografering online från ditt foto

Skapa stickers från foto online med AI
Avatar Generator Online med AI

AI-generator för bröllopsfoton
Förbättra bildkvalitet online med AI

AI Familjevapen Generator

Inredning online med AI

AI-generator för gratulationskort

Skapa videoförhandsvisning online med AI

Skapa banner online med AI
AI-logotypskapare online
Produktfotografering med AI

AI-fotoredigerare online

Produktfotografering med AI-modeller
Skapare av produktinfografik för marknadsplatser
Ozon produktinfografik
Wildberries produktinfografik
Verktyg för Avito-infografik
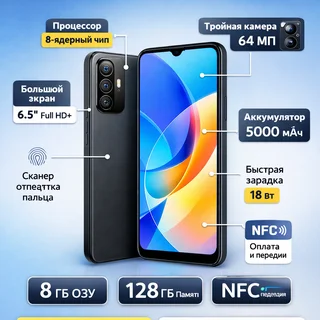
Produktinfografik för Yandex Market
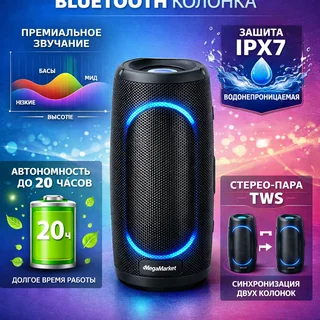
MegaMarket Produktinfografik

AI-bilduppskalare — Öka upplösningen upp till 4x
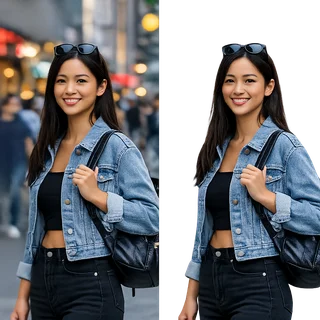
Ta bort bakgrund från foto med AI