Twórz infografiki online z AI
💡 Opisz dane lub proces do wizualizacji (np. 'statystyki wzrostu firmy', 'workflow marketingowy', 'oś czasu'). Określ cel i styl: profesjonalny, kolorowy lub minimalistyczny.
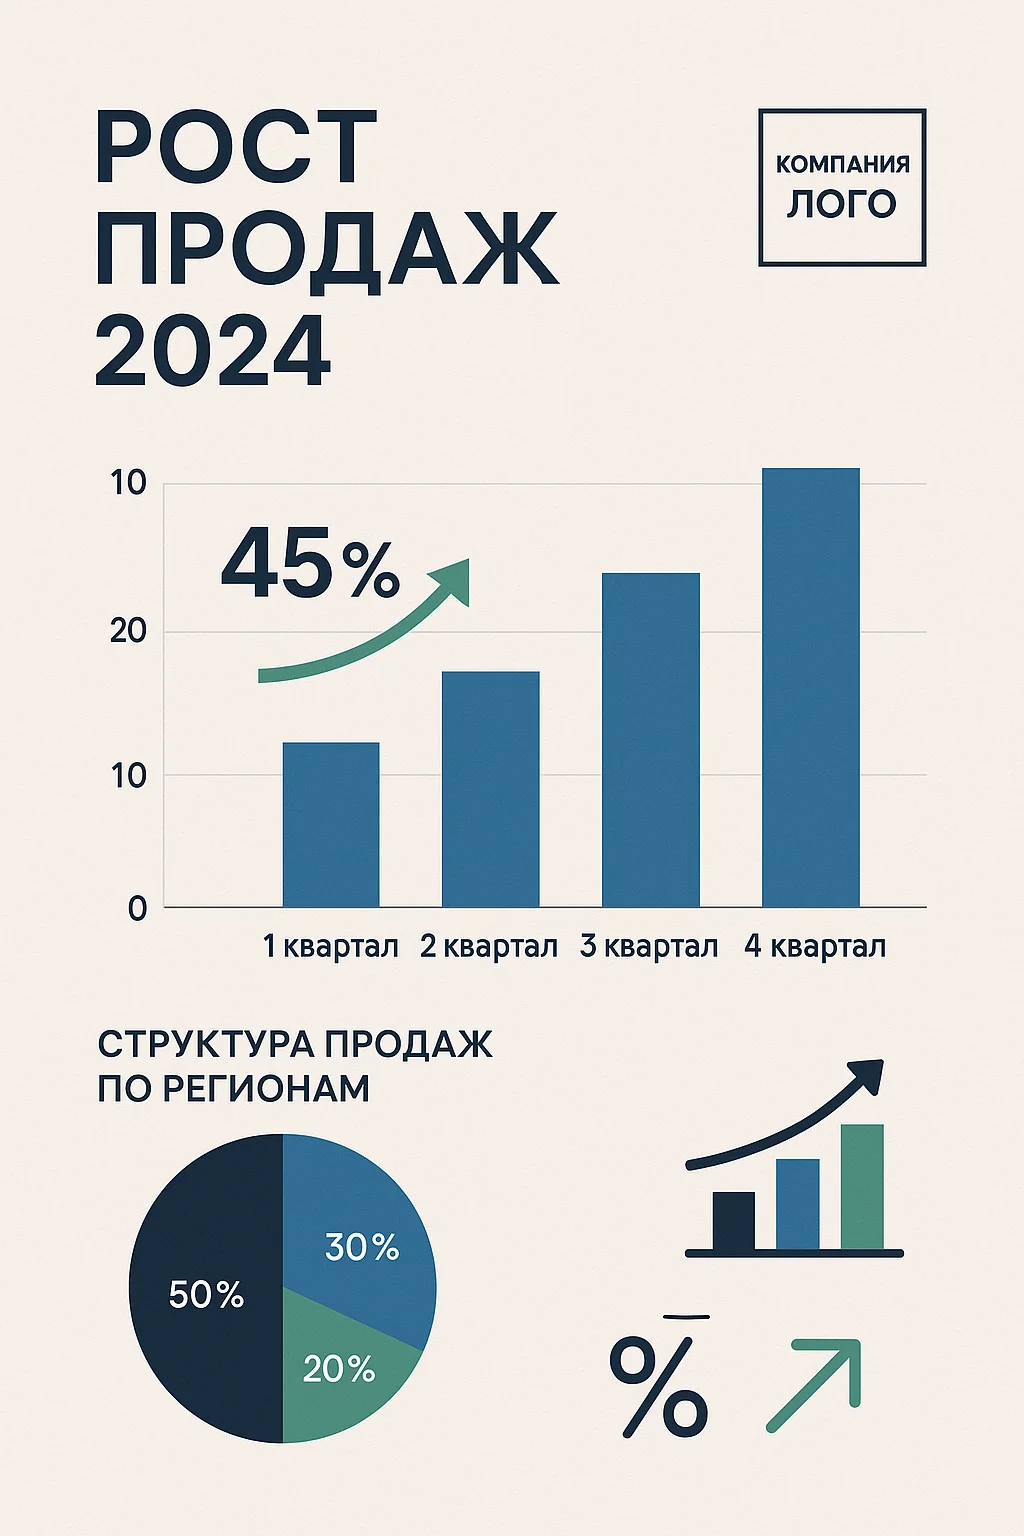
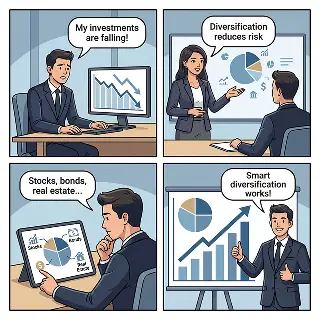
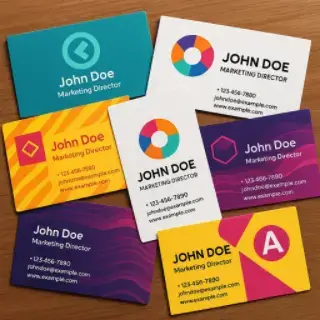
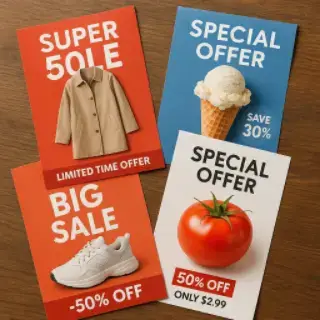
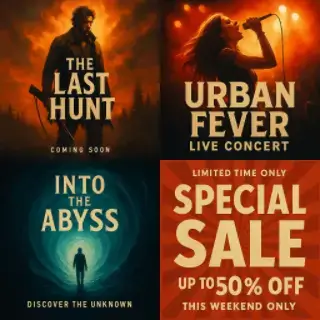
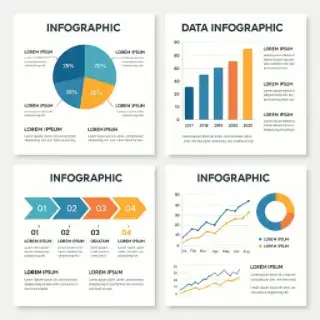
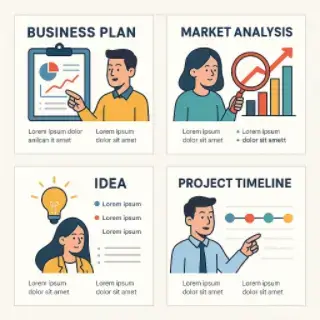
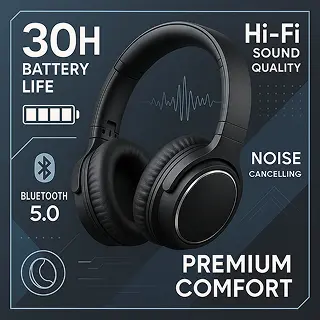
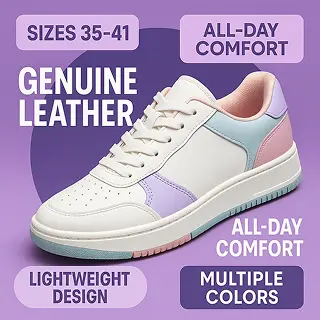
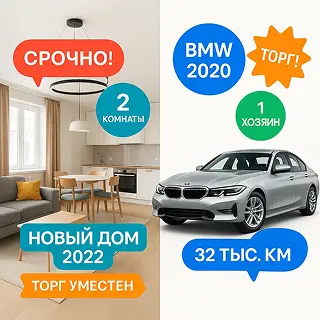
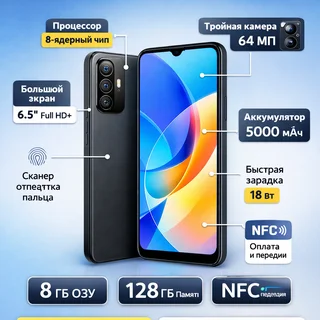
Przykłady utworzonych obrazów


Generator infografik dla biznesu, edukacji i marketingu
Twórz infografiki online z AI, aby wizualizować dane, wyjaśniać procesy i prezentować złożone informacje w angażującej formie. Generuj projekty infografik do prezentacji biznesowych, marketingu i treści edukacyjnych z wykresami i diagramami.
Kluczowe cechy:
- Projekty infografik dla biznesu, edukacji i prezentacji marketingowych
- Wiele stylów: wykresy danych, schematy procesów, osie czasu i grafiki porównawcze
- Inteligentna wizualizacja danych z wykresami, ikonami i hierarchią wizualną
- Integracja treści zoptymalizowana pod kątem przejrzystej prezentacji informacji
- Wysoka rozdzielczość do prezentacji, raportów i materiałów marketingowych
- Elastyczne dostosowanie projektu do różnych platform i potrzeb
Wszystkie AI do generowania obrazów
Świąteczne zdjęcie w kostiumie AI
Generator obrazów AI
Stwórz kartkę na Dzień Kobiet online z AI
Stwórz Obraz Bogini za pomocą AI
Generator kartek na 23 lutego z AI

Walentynkowe efekty do zdjęć z AI

Generator kartek walentynkowych z AI
Generator menu i cenników AI
Generator komiksów AI

Życzenia na dzień dobry z Twoim zdjęciem
Twórz wizytówki online z AI
Twórz ulotki online z AI
Twórz plakaty online z AI
Twórz posty do social mediów z AI
Twórz ogłoszenia biznesowe z AI
Twórz infografiki online z AI
Twórz slajdy prezentacji online z AI
Odnawianie starych zdjęć online z AI

Generator zdjęć AI na podstawie referencji
Postarzanie twarzy online z AI

Sesja zdjęciowa AI online z Twojego zdjęcia

Twórz naklejki ze zdjęć online przy użyciu AI
Generator awatarów online z AI

Generator zdjęć ślubnych AI
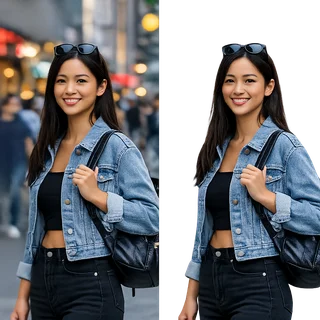
Popraw jakość zdjęć online dzięki AI

Generator herbów rodzinnych AI

Projektowanie wnętrz online z AI

Generator kartek okolicznościowych AI

Stwórz podgląd wideo online z AI

Stwórz baner online przy użyciu AI
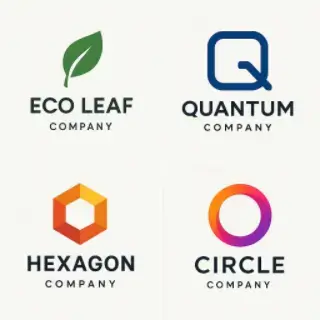
Generator Logo AI – Sieć Neuronowa
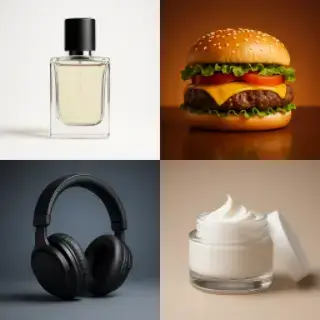
Fotografia produktowa z AI

Edytor Zdjęć AI Online
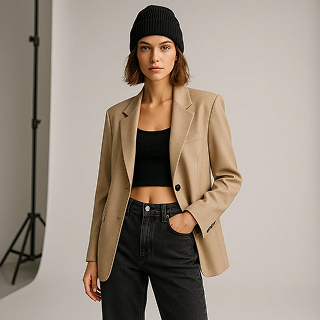
Fotografia produktowa z modelami AI
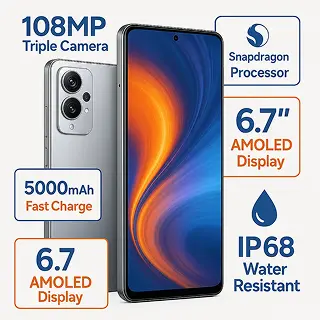
Kreator infografik produktowych na marketplace
Infografika produktowa na Ozon
Infografika produktowa na Wildberries
Kreator Infografik do Ogłoszeń Avito
Yandex Market Product Infographic
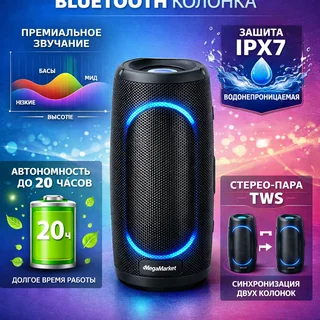
MegaMarket Product Infographic
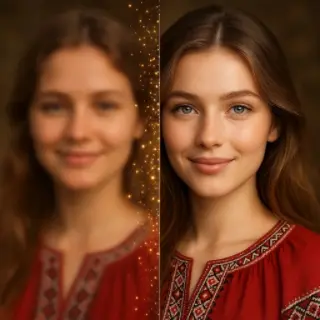
Popraw jakość zdjęć online dzięki AI
Twórz naklejki ze zdjęć online przy użyciu AI