Maak online infographics met AI
💡 Beschrijf uw data of proces om te visualiseren (bijv. 'bedrijfsgroeistatistieken', 'marketingworkflow', 'tijdlijn'). Vermeld doel en stijl: professioneel, kleurrijk of minimalistisch.
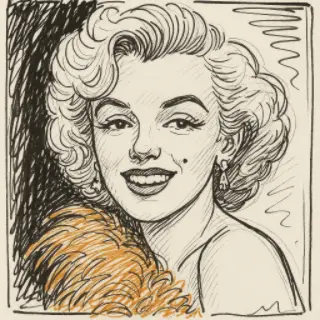
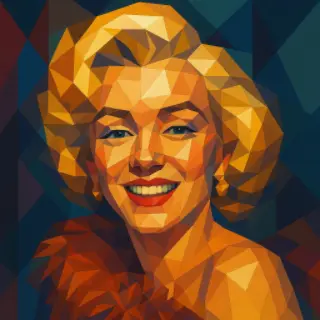
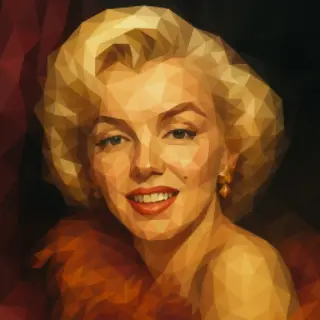
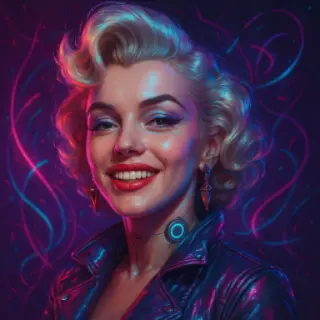
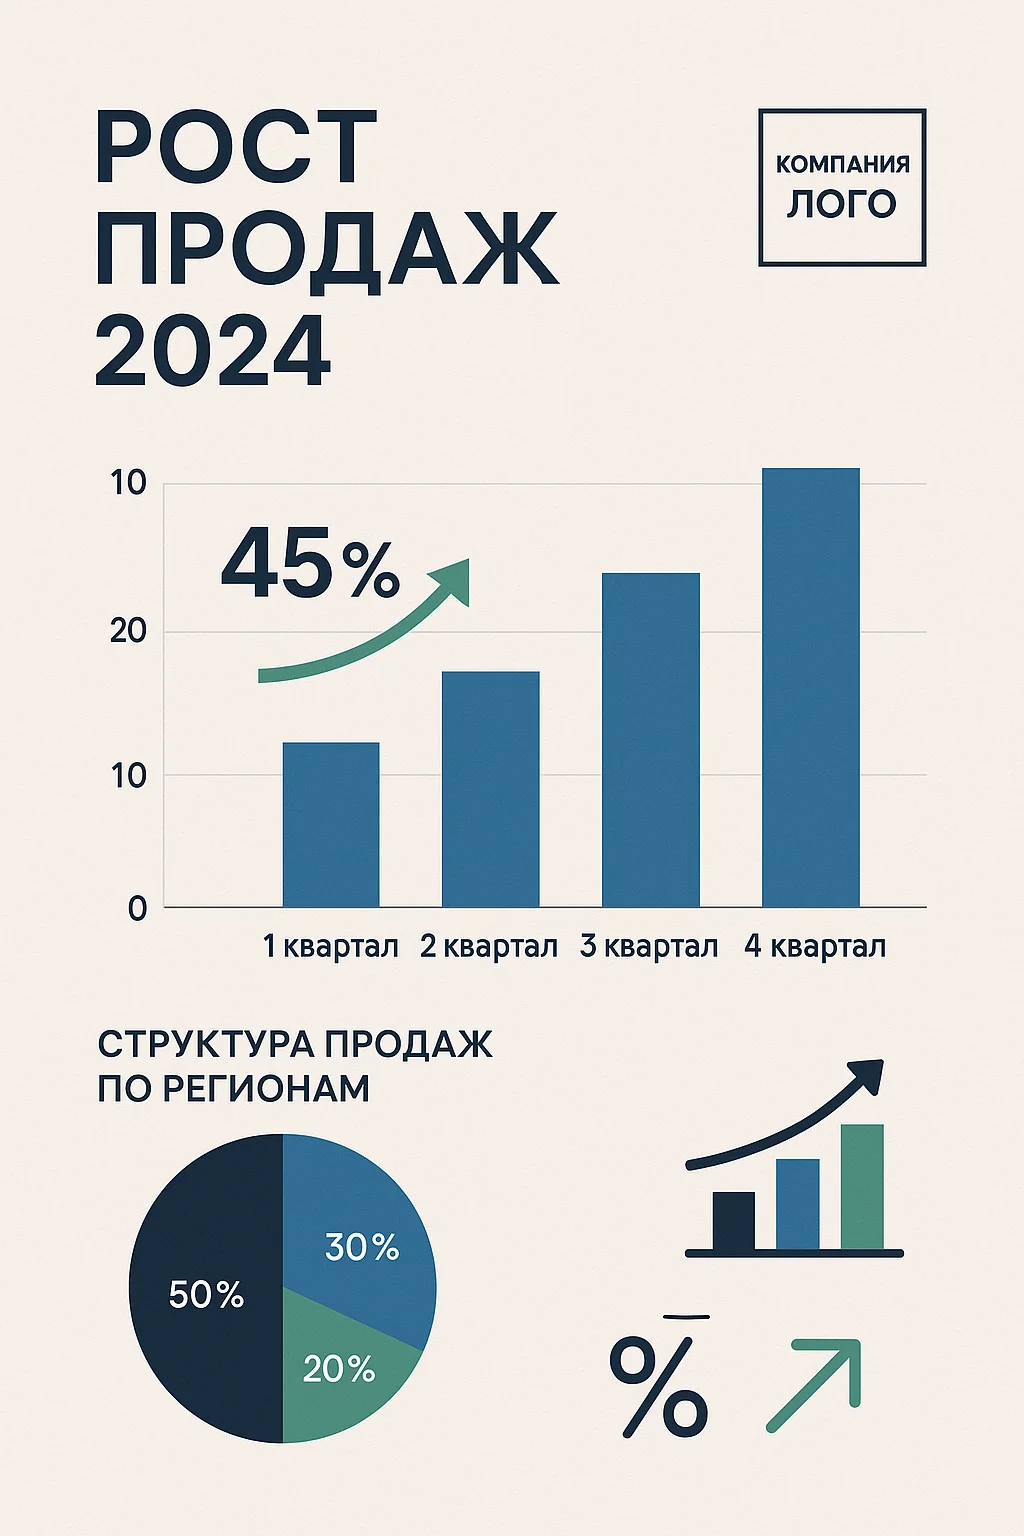
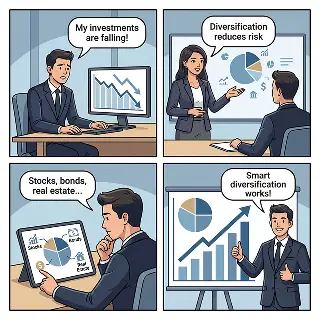
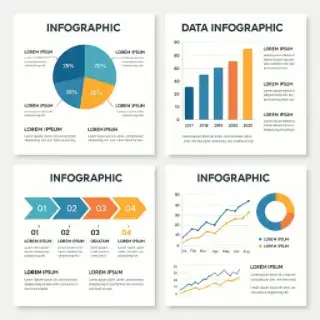
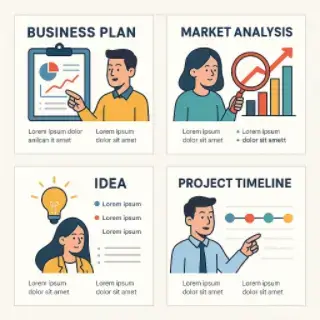
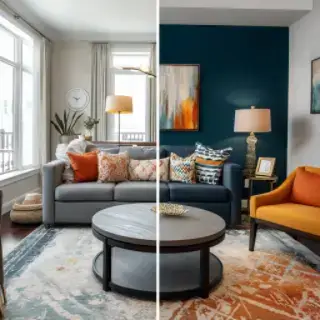
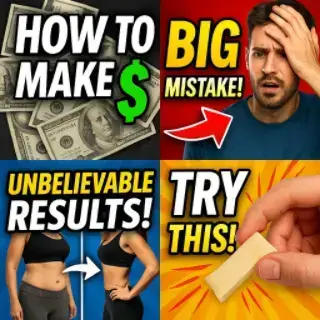
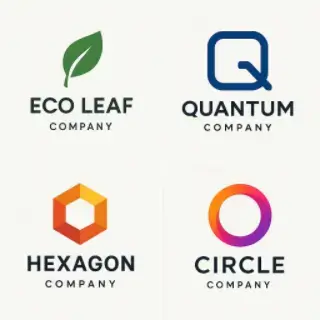
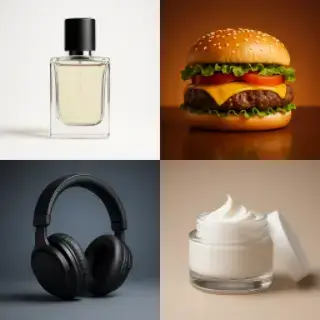
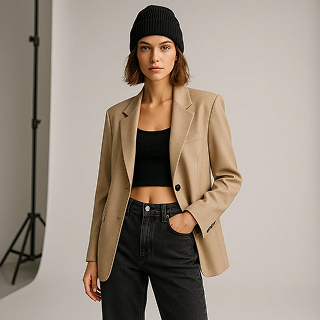
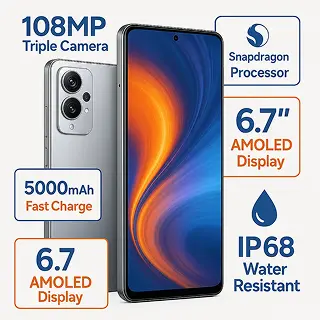
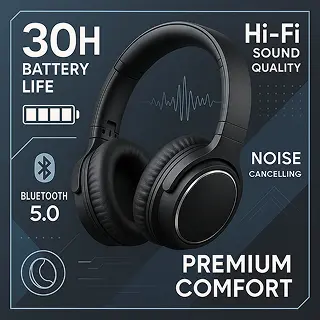
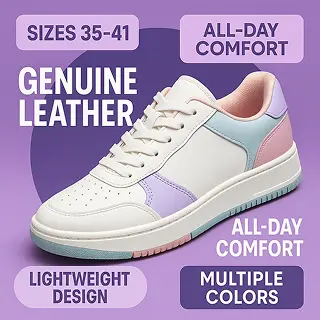
Voorbeelden van gemaakte afbeeldingen


Infographic Generator voor Bedrijven, Onderwijs en Marketing
Maak online infographics met AI om data te visualiseren, processen uit te leggen en complexe informatie visueel aantrekkelijk te presenteren. Genereer infographic-ontwerpen voor zakelijke presentaties, marketing en educatieve content met grafieken en diagrammen.
Belangrijkste kenmerken:
- Infographic ontwerpen voor zakelijke, educatieve en marketingpresentaties
- Meerdere stijlen: datagrafieken, processtromen, tijdlijnen en vergelijkingsgrafieken
- Slimme datavisualisatie met diagrammen, grafieken, iconen en visuele hiërarchie
- Contentintegratie geoptimaliseerd voor heldere informatiepresentatie
- Output in hoge resolutie voor presentaties, rapporten en marketingmateriaal
- Flexibel aanpasbaar design voor diverse platforms en behoeften
Alle AI voor het genereren van afbeeldingen

Kerstkostuum op foto met AI
AI Afbeeldingsgenerator

Maak online een 8 maart-kaart met AI
Maak Godin-afbeelding met AI
23 februari kaartgenerator met AI

Romantische Foto-effecten voor Valentijnsdag met AI

Valentijnskaart-generator met AI
AI Menu- en Prijslijstgenerator
AI Stripverhaal Generator

Goedemorgenwensen met je eigen foto
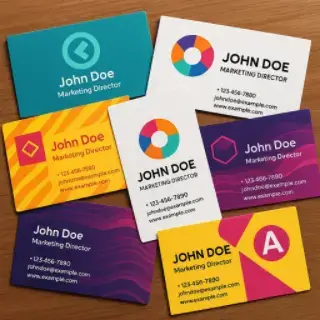
Maak online visitekaartjes met AI
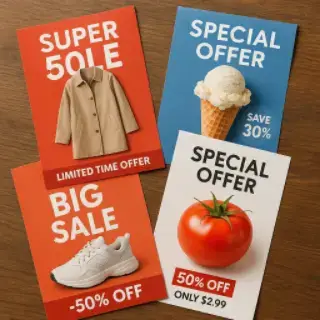
Online Flyers Maken met AI
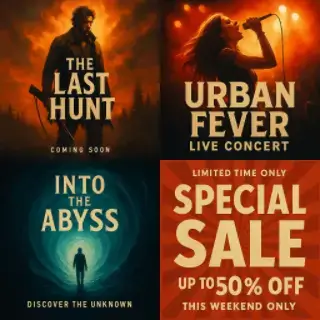
Maak posters online met AI
Maak social media posts met AI
Maak zakelijke aankondigingen met AI
Maak online infographics met AI
Maak Online Presentatieslides met AI
Oude foto's online herstellen met AI

AI Photo Generator from Your Photo
Gezicht Verouderen Online met AI

AI Fotoshoot Online van Je Eigen Foto

Maak online een sticker van een foto met AI
Avatar Generator Online met AI

AI-trouwfotogenerator
Verbeter Fotokwaliteit Online met AI

AI Familie Wapen Generator
Interieurontwerp Online met AI

Wenskaartengenerator met AI
Maak Video Preview Online met AI

Maak online banners met AI
AI Logo Generator Online
Productfotografie met AI

AI Foto-editor Online
Productfotografie met AI-modellen
Marktplaats Product Infographic Maker
Ozon Product Infographic
Wildberries Product Infographic
Avito Advertentie Infographic Maker
Yandex Market Product Infographic
MegaMarket Product Infographic
AI Image Upscaler — Increase Resolution up to 4x
Remove Background from Photo with AI