AIでインフォグラフィックをオンライン作成
💡 可視化したいデータやプロセスを説明してください(例:「企業の成長統計」「マーケティングワークフロー」「タイムライン」)。目的やスタイル(プロフェッショナル、カラフル、ミニマリストなど)も含めてください。
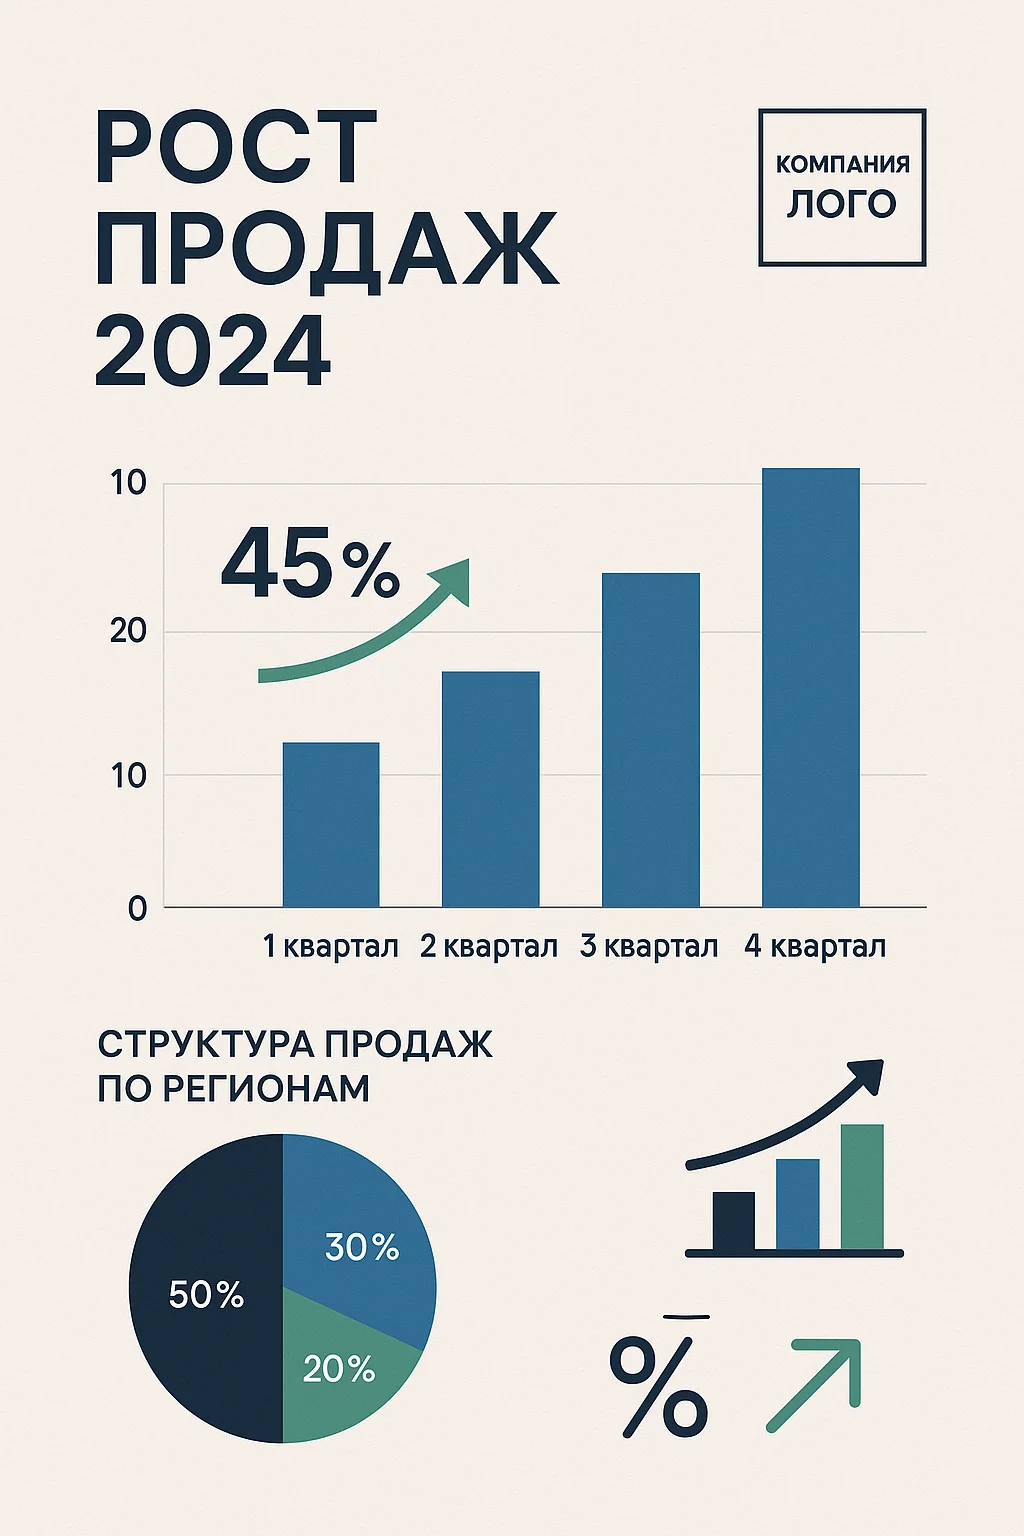
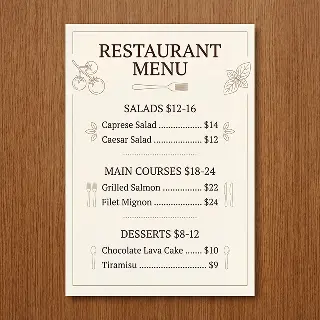
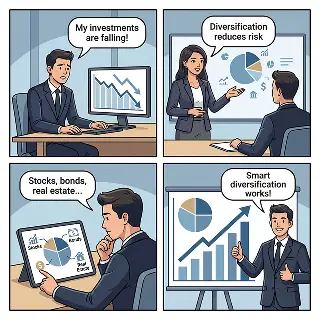
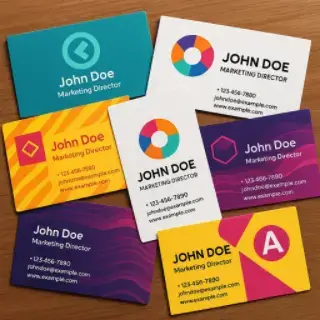
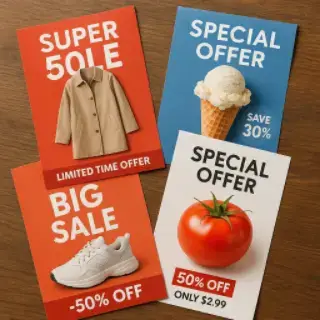
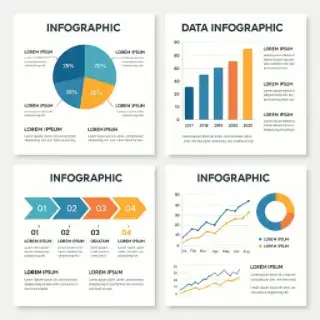
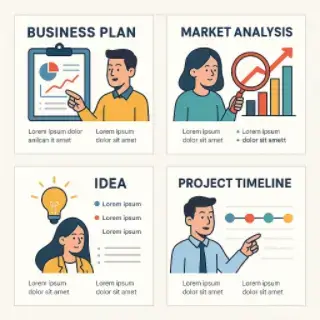
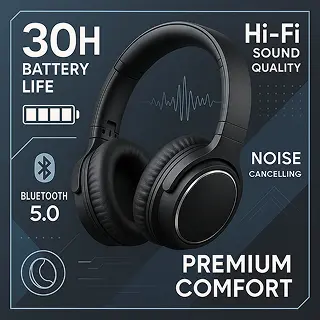
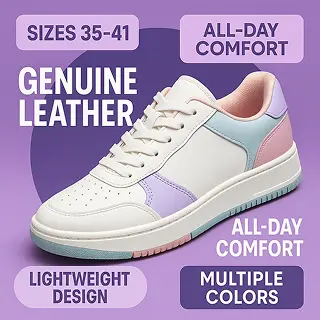
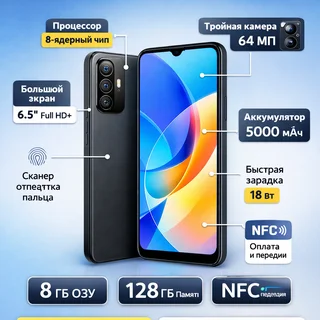
作成された画像の例


ビジネス、教育、マーケティング向けインフォグラフィック生成ツール
AIを使ってオンラインでインフォグラフィックを作成し、データを可視化。プロセスを説明し、複雑な情報を魅力的なビジュアル形式で提示します。ビジネスプレゼンテーション、マーケティング、教育コンテンツ向けのチャートやグラフを含むデザインを生成できます。
主な機能:
- ビジネス、教育、マーケティングのプレゼン資料向けインフォグラフィックデザイン
- 多彩なスタイル:データチャート、プロセスフロー、タイムライン、比較グラフィック
- チャート、グラフ、アイコン、視覚的階層を活用したスマートなデータ可視化
- 情報を明確に伝えるために最適化されたコンテンツ統合
- プレゼン、レポート、販促資料向けの高品質な高解像度出力
- 様々なプラットフォームやニーズに対応する柔軟なデザインカスタマイズ
画像生成のためのすべてのAI

AIクリスマス衣装フォト

AI画像ジェネレーター

AIで3月8日のカードをオンライン作成

AIで女神の画像を作成する

AI搭載 2月23日カードジェネレーター

AIによるバレンタイン向けロマンチック写真エフェクト

AIバレンタインカードジェネレーター
AIメニュー・料金表ジェネレーター
AIマンガ・コミック生成ツール

写真入り「おはよう」メッセージ作成
AIで名刺をオンライン作成
AIでチラシをオンライン作成
AIでポスターをオンライン作成

AIでSNS投稿を作成
AIでビジネス告知を作成
AIでインフォグラフィックをオンライン作成
AIでプレゼン資料をオンライン作成
AIで古い写真をオンライン修復

写真からAI画像を生成
AI顔年齢シミュレーター

あなたの写真から作るオンラインAI写真集

AIで写真からステッカーをオンライン作成
AI搭載オンラインアバター作成ツール

AIウェディングフォトジェネレーター
AIで写真の画質をオンラインで向上

AI家紋ジェネレーター

AIによるオンラインインテリアデザイン

AI搭載グリーティングカード作成ツール

AIで動画プレビューをオンライン作成

AIでバナーをオンライン作成
AIロゴ作成ツール オンライン

AI商品写真作成

オンラインAI写真編集

AIモデルを活用した商品撮影
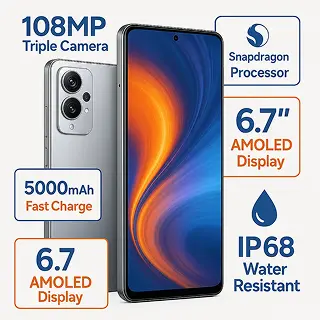
マーケットプレイス向け商品インフォグラフィック作成ツール
Ozon商品インフォグラフィック
Wildberries商品インフォグラフィック
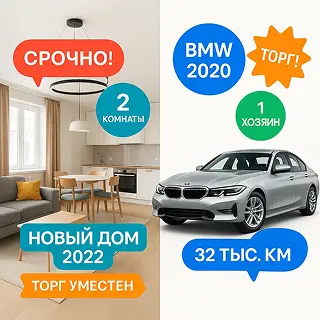
Avito広告インフォグラフィック作成
Yandex Market 商品インフォグラフィック
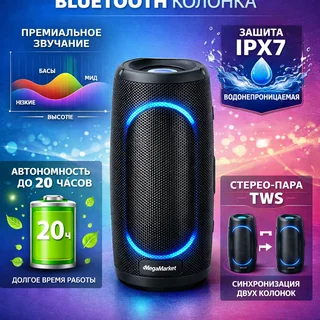
メガマーケット用商品インフォグラフィック

AI画像高画質化ツール — 解像度を最大4倍にアップスケール
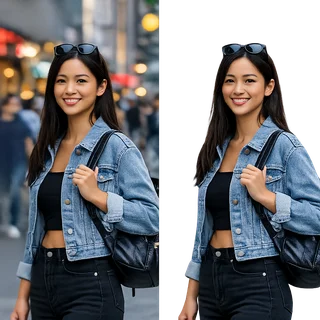
AIで写真の背景を削除