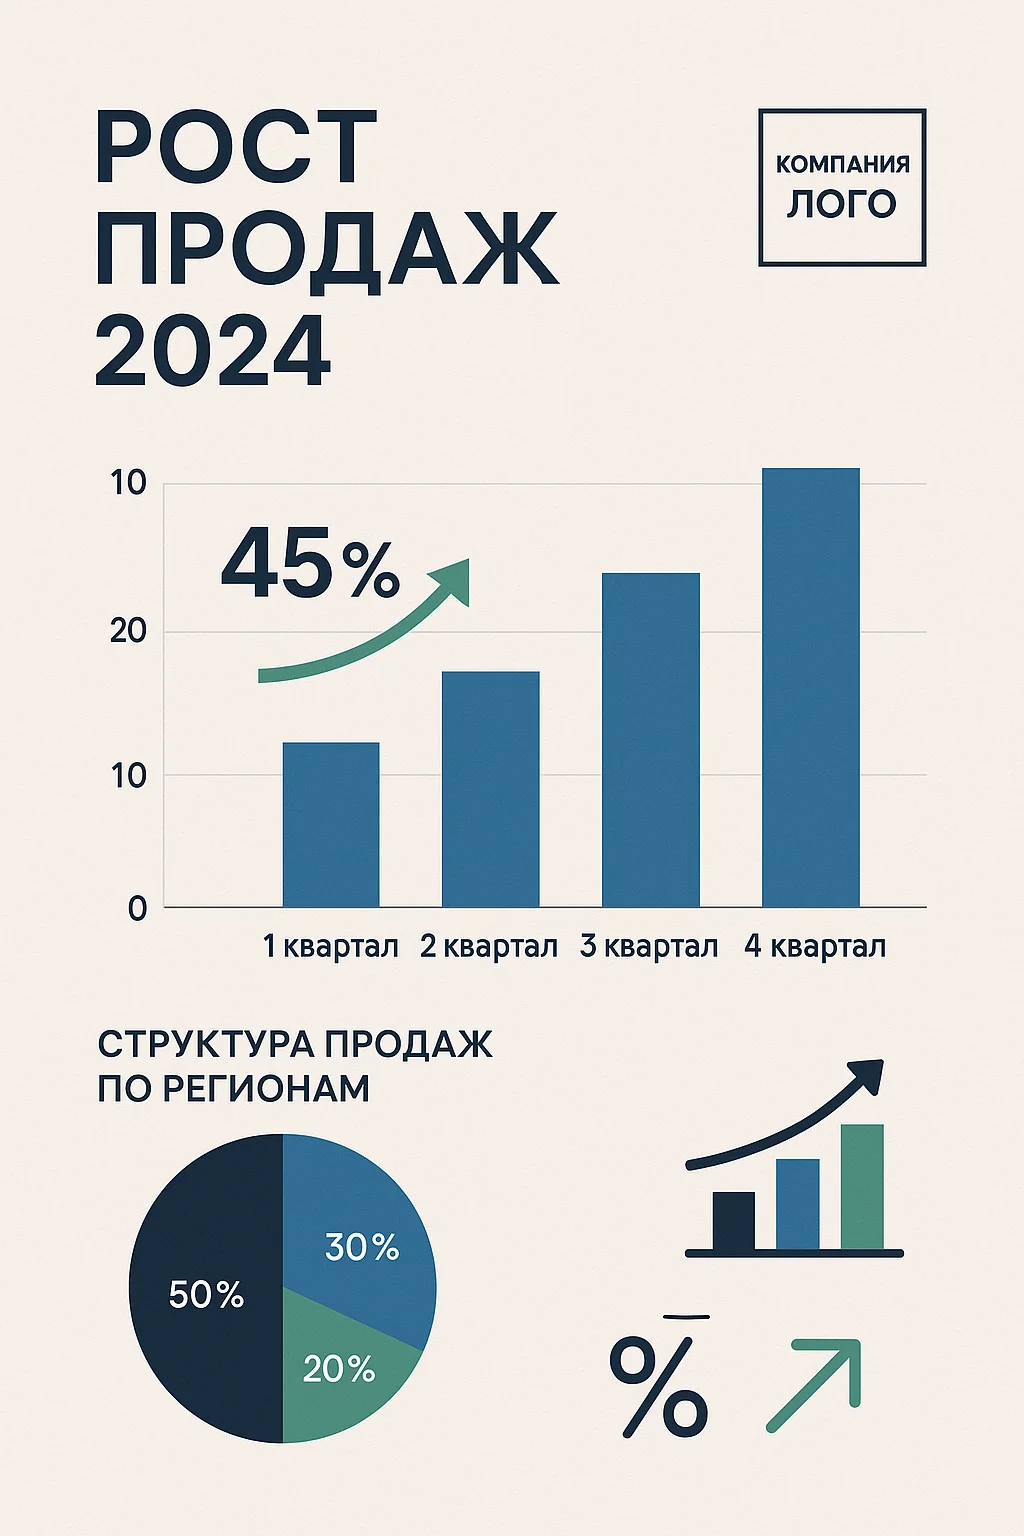
Infografiken online mit KI erstellen
💡 Beschreiben Sie Ihre Daten oder Ihren Prozess zur Visualisierung (z. B. 'Wachstumsstatistiken des Unternehmens', 'Marketing-Workflow', 'Zeitstrahl'). Geben Sie Zweck und Stil an: professionell, farbenfroh oder minimalistisch.
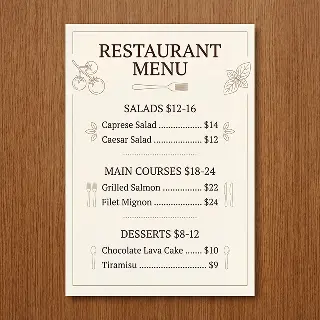
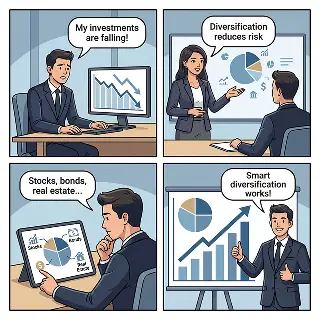
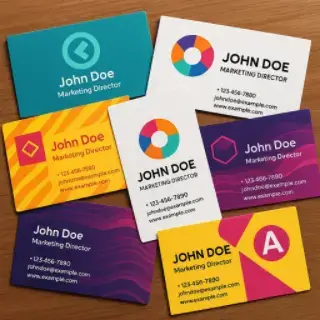
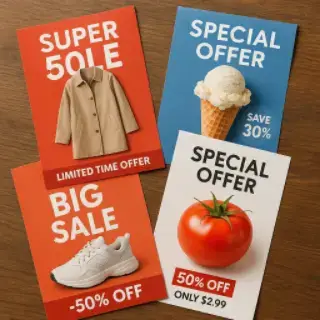
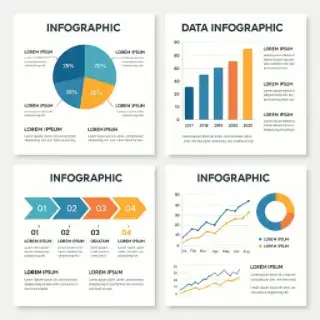
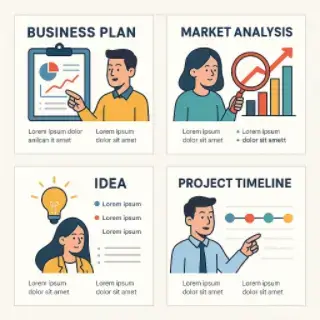
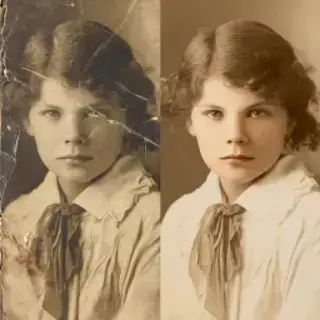
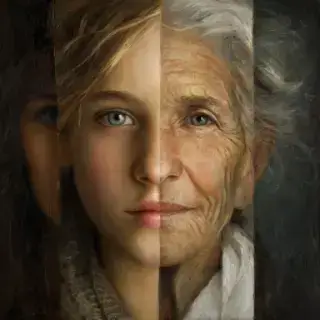
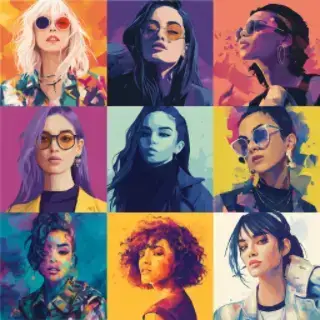
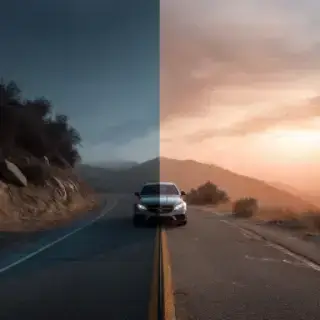
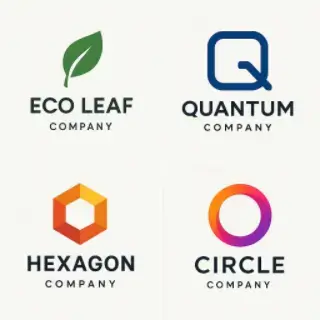
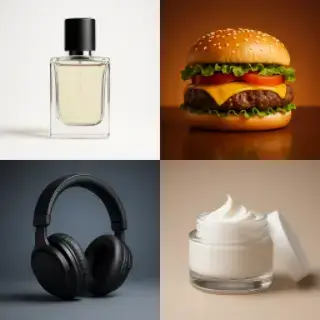
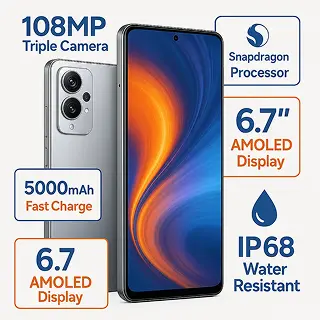
Beispiele für erstellte Bilder


Infografik-Generator für Business, Bildung und Marketing
Erstellen Sie online Infografiken mit KI, um Daten zu visualisieren, Prozesse zu erklären und komplexe Informationen in einem ansprechenden visuellen Format darzustellen. Generieren Sie Infografik-Designs für Geschäftspräsentationen, Marketing und Bildungsinhalte mit Diagrammen und Grafiken.
Hauptmerkmale:
- Infografik-Designs für Unternehmen, Bildung und Marketingpräsentationen
- Vielfältige Stile: Datendiagramme, Prozessabläufe, Zeitstrahlen und Vergleichsgrafiken
- Intelligente Datenvisualisierung mit Diagrammen, Grafiken, Icons und visueller Hierarchie
- Inhaltsintegration, optimiert für eine klare Informationsdarstellung
- Hochauflösende Ausgabe für Präsentationen, Berichte und Marketingmaterialien
- Flexible Designanpassung für verschiedene Plattformen und Anforderungen
Alle KI für die Bilderzeugung
Weihnachtskostüm-Foto mit KI

KI Bildgenerator

Karte zum 8. März online mit KI erstellen
Göttinnenbild mit KI erstellen
Kartengenerator für den 23. Februar mit KI

Romantische Valentinstag-Fotoeffekte mit KI

Valentinstagskarten-Generator mit KI
KI-Generator für Speisekarten und Preislisten
KI-Comic-Strip-Generator

Guten-Morgen-Wünsche mit eigenem Foto
Visitenkarten online mit KI erstellen
Flyer online mit KI erstellen
Plakate online mit KI erstellen
Social Media Posts mit KI erstellen
Geschäftliche Ankündigungen mit KI erstellen
Infografiken online mit KI erstellen
Präsentationen online mit KI erstellen
Alte Fotos online mit KI wiederherstellen

KI-Fotogenerator aus Referenzbild
Gesicht online altern lassen mit KI

Online-KI-Fotoshooting aus Ihrem Foto

Sticker aus Foto online mit KI erstellen
Online KI Avatar Generator

KI-Hochzeitsfoto-Generator
Fotoqualität online mit KI verbessern

KI-Familienwappen-Generator

Interior Design online mit KI

KI-Grußkarten-Generator

Video-Vorschau online mit KI erstellen

Banner online mit KI erstellen
KI-Logo-Generator
Produktfotografie mit KI

KI-Foto-Editor Online

Produktfotografie mit KI-Models
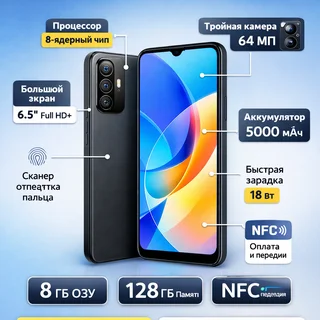
Marktplatz Produkt-Infografik Ersteller

Ozon Produkt-Infografik
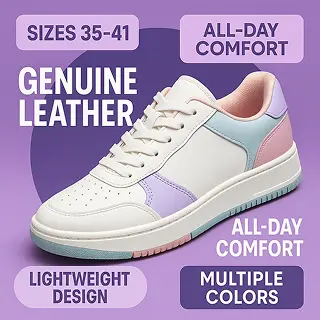
Wildberries Produkt-Infografik
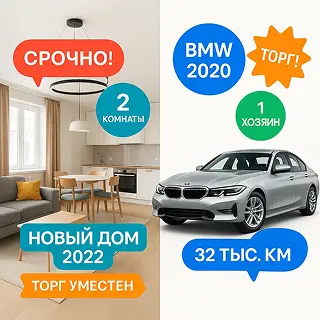
Avito Anzeigen-Infografik-Creator
Yandex Market Product Infographic
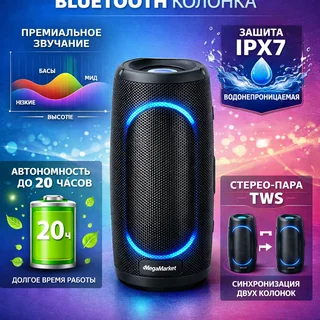
MegaMarket Product Infographic
Fotoqualität online mit KI verbessern
Sticker aus Foto online mit KI erstellen