Vytvořit infografiku online s AI
💡 Popište data nebo proces k vizualizaci (např. 'statistiky růstu firmy', 'marketingový workflow', 'časová osa'). Uveďte účel a styl: profesionální, barevný nebo minimalistický.
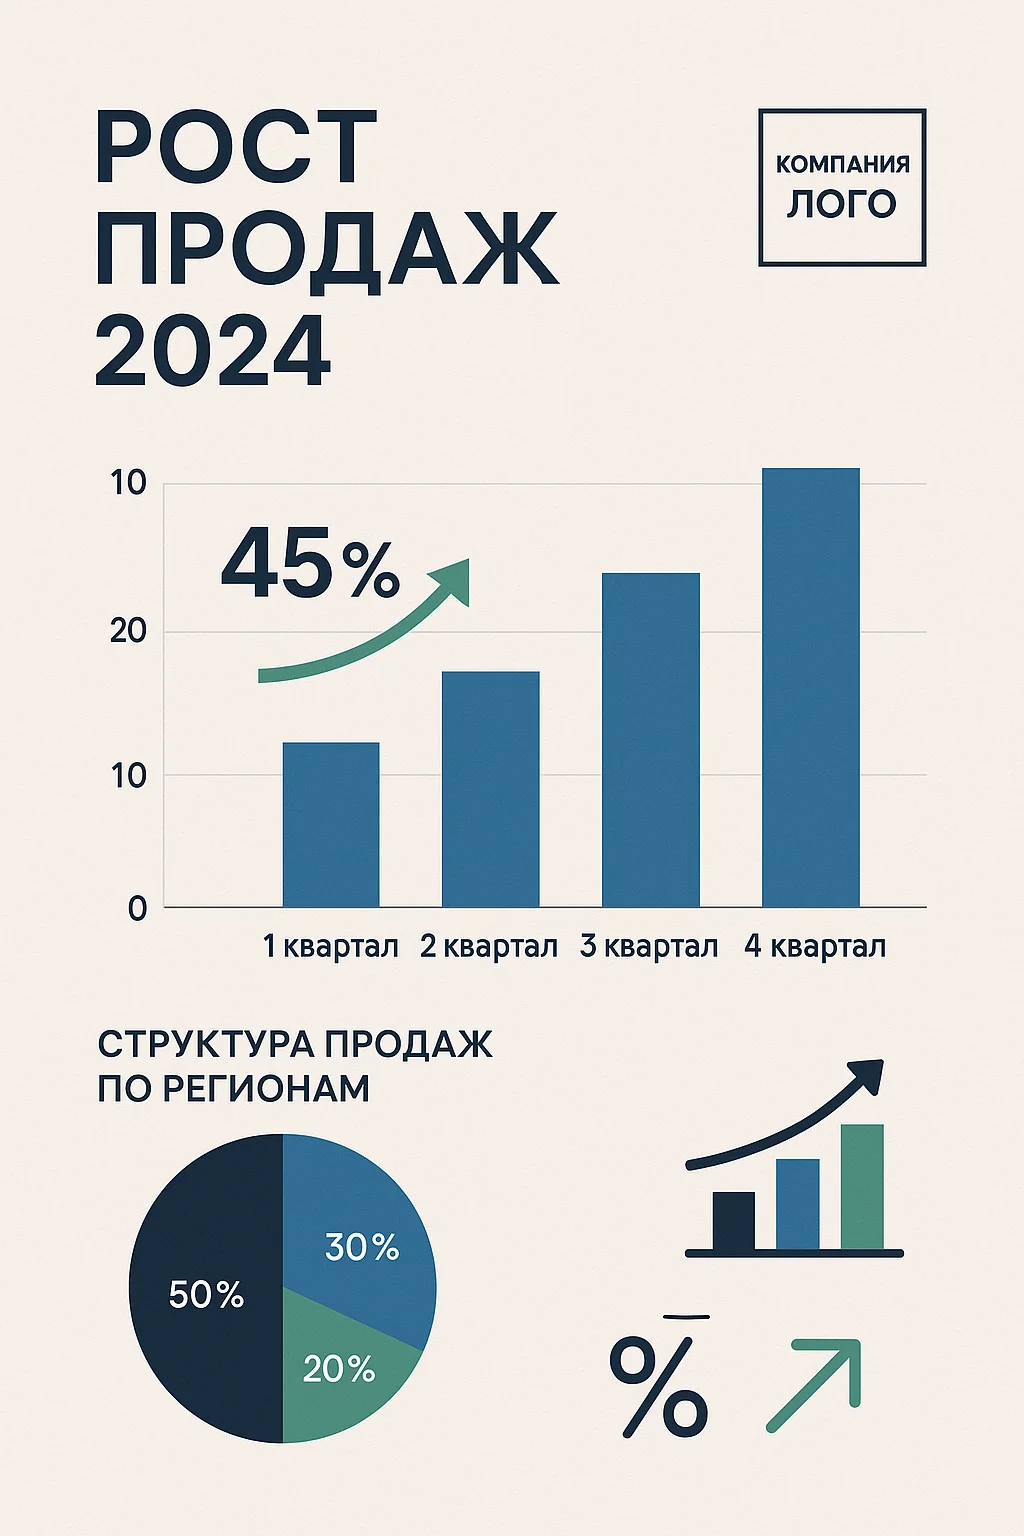
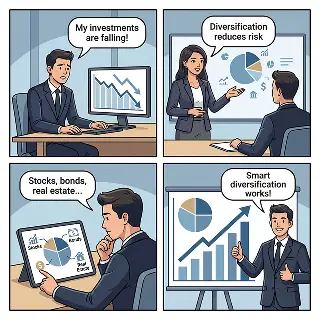
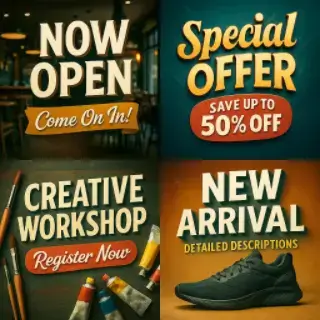
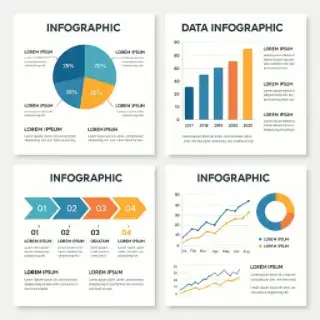
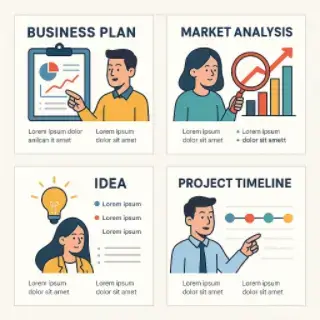
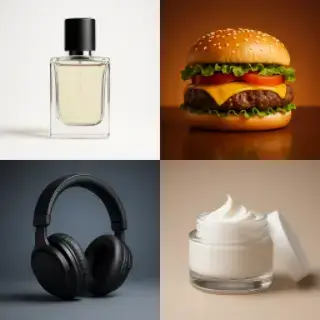
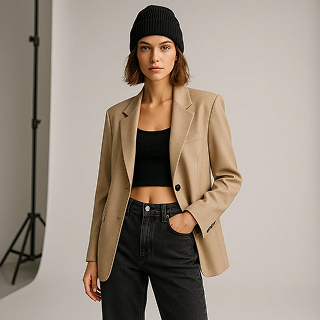
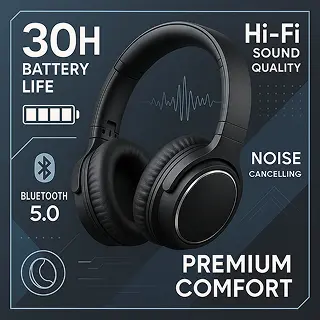
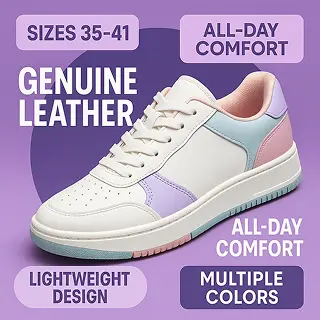
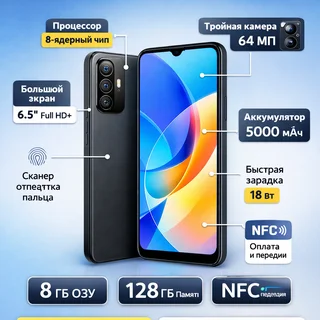
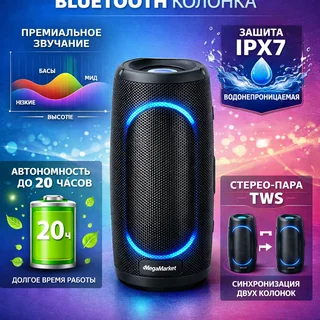
Příklady vytvořených obrázků


Generátor infografiky pro podnikání, vzdělávání a marketing
Vytvářejte infografiky online pomocí AI pro vizualizaci dat, vysvětlení procesů a prezentaci složitých informací v poutavém vizuálním formátu. Generujte návrhy infografik pro obchodní prezentace, marketing a vzdělávací obsah s grafy a diagramy.
Klíčové vlastnosti:
- Návrhy infografiky pro podnikání, vzdělávání a marketingové prezentace
- Různé styly: datové grafy, procesní schémata, časové osy a srovnávací grafika
- Inteligentní vizualizace dat s grafy, diagramy, ikonami a vizuální hierarchií
- Integrace obsahu optimalizovaná pro přehlednou prezentaci informací
- Výstup ve vysokém rozlišení pro prezentace, reporty a marketingové materiály
- Flexibilní úprava designu pro různé platformy a potřeby
Všechna AI pro generování obrázků

Vánoční fotka v kostýmu s AI
AI generátor obrázků

Vytvořit přání k MDŽ online pomocí AI
Vytvořit obraz bohyně s AI
Generátor přání k 23. únoru s AI

Valentýnské romantické foto efekty s AI

Generátor valentýnských přání s AI
AI generátor menu a ceníků
AI generátor komiksů

Přání dobrého rána s vaší fotkou
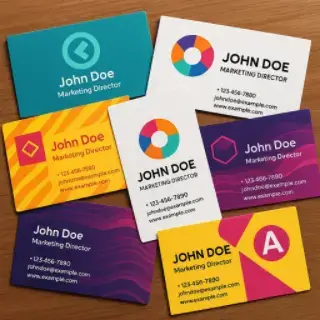
Tvorba vizitek online pomocí AI
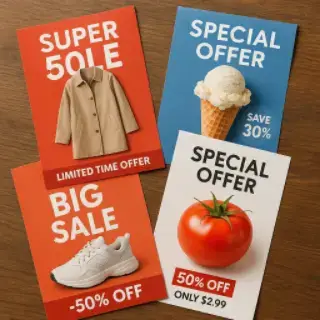
Vytvořit letáky online pomocí AI
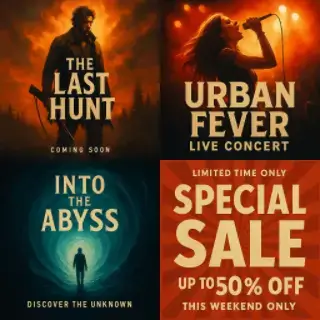
Tvorba plakátů online s AI

Vytvořit příspěvky na sociální sítě pomocí AI
Vytvářejte firemní oznámení pomocí AI
Vytvořit infografiku online s AI
Vytvářejte prezentační snímky online pomocí AI
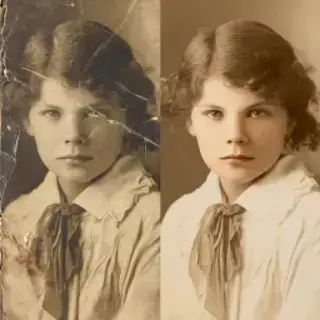
Obnova starých fotografií online pomocí AI

AI generátor fotek z vaší fotky
Změna věku obličeje online s AI

AI focení online z vaší fotografie

Vytvořit samolepku z fotky online pomocí AI
Online generátor avatarů s AI

AI generátor svatebních fotek
Zlepšení kvality fotek online pomocí AI

AI Generátor rodinných erbů

Návrh interiéru online s AI

Generátor přání s AI

Vytvořit náhled videa online s AI

Vytvořit banner online s AI
AI generátor loga online
Produktová fotografie s AI

AI editor fotek online
Produktová fotografie s AI modely
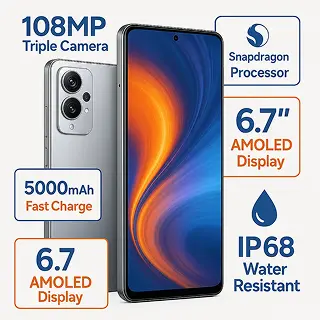
Nástroj na tvorbu produktové infografiky pro tržiště
Produktová infografika pro Ozon
Produktová infografika pro Wildberries
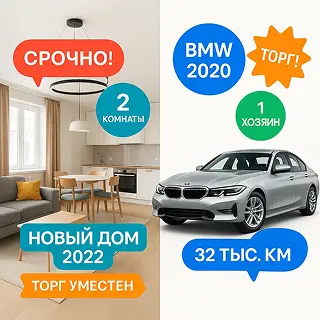
Nástroj na tvorbu infografiky pro Avito
Produktová infografika pro Yandex Market
Produktová infografika pro MegaMarket
AI Upscaler obrázků — Zvýšení rozlišení až 4x
Odstranění pozadí z fotky pomocí AI