تصميم إنفوجرافيك أونلاين بالذكاء الاصطناعي
💡 صف بياناتك أو العملية التي تريد تصورها (مثلاً: 'إحصائيات نمو الشركة'، 'سير عمل التسويق'، 'جدول زمني'). حدد الغرض والأسلوب: احترافي، ملون، أو بسيط.
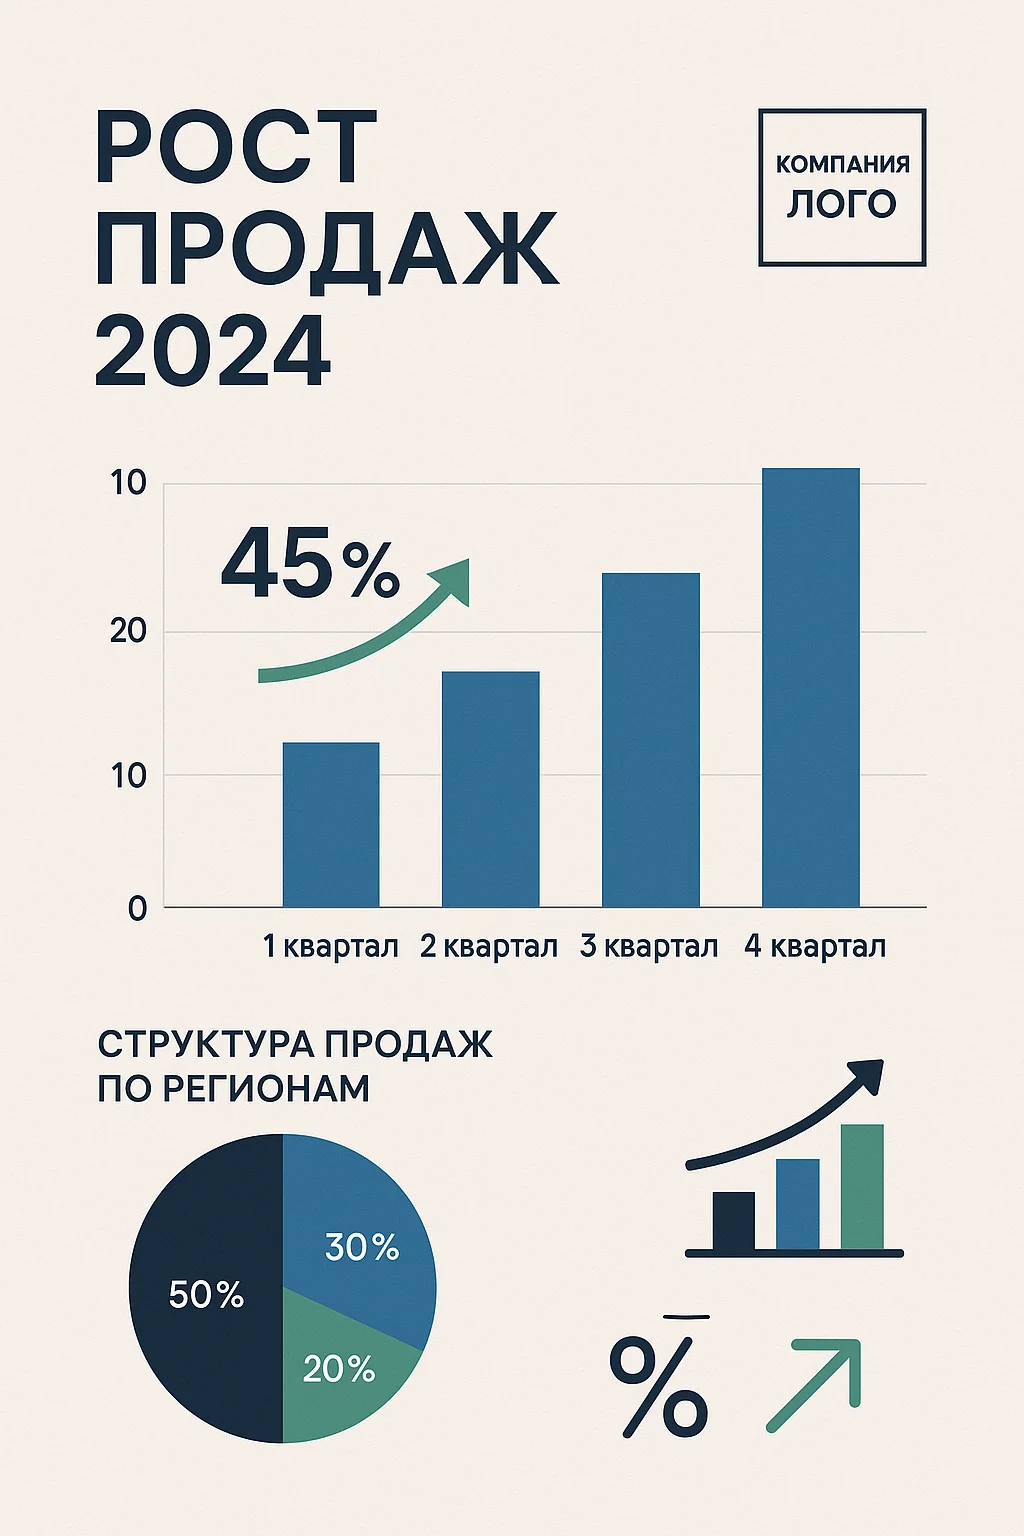
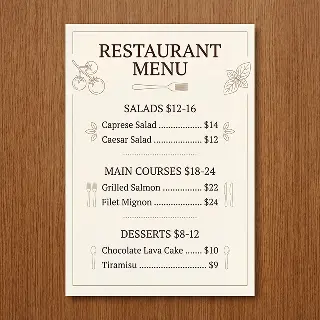
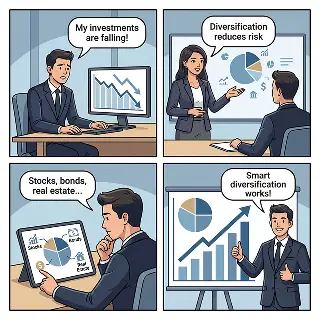
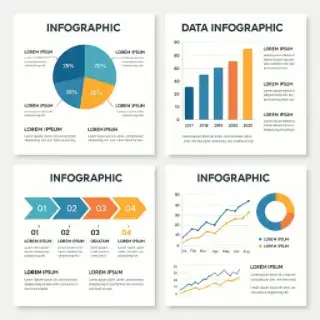
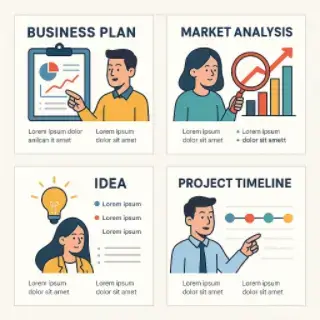
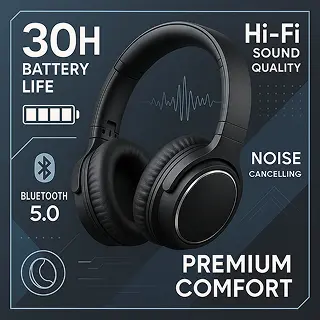
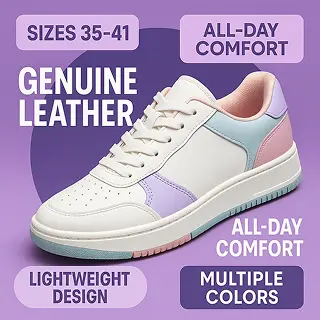
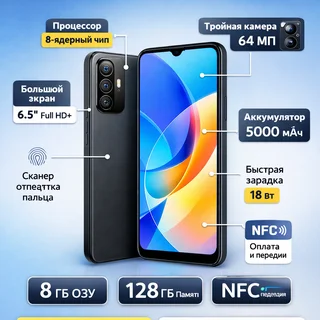
أمثلة على الصور التي تم إنشاؤها


مولد الإنفوجرافيك للأعمال والتعليم والتسويق
أنشئ الإنفوجرافيك أونلاين باستخدام الذكاء الاصطناعي لتصور البيانات وشرح العمليات وعرض المعلومات المعقدة بتنسيق مرئي جذاب. قم بتوليد تصاميم إنفوجرافيك لعروض الأعمال والتسويق والمحتوى التعليمي مع المخططات والرسوم البيانية.
الميزات الرئيسية:
- تصاميم إنفوجرافيك احترافية للأعمال والتعليم والعروض التقديمية التسويقية
- أنماط متعددة: مخططات البيانات، وسير العمليات، والجداول الزمنية، ورسومات المقارنة
- تمثيل مرئي ذكي للبيانات مع المخططات والرسوم البيانية والأيقونات والتسلسل الهرمي البصري
- تكامل المحتوى المحسن لعرض المعلومات بشكل واضح ودقيق
- مخرجات عالية الدقة للعروض التقديمية والتقارير والمواد التسويقية
- تخصيص مرن للتصميم ليناسب مختلف المنصات والاحتياجات
كل الذكاء الاصطناعي لتوليد الصور

صور أزياء الكريسماس بالذكاء الاصطناعي

مولد صور الذكاء الاصطناعي

تصميم بطاقة 8 مارس أونلاين بالذكاء الاصطناعي

إنشاء صورة آلهة بالذكاء الاصطناعي

مولد بطاقات 23 فبراير بالذكاء الاصطناعي

مؤثرات صور رومانسية لعيد الحب بالذكاء الاصطناعي

مولد بطاقات عيد الحب بالذكاء الاصطناعي
مولد قوائم الطعام وقوائم الأسعار بالذكاء الاصطناعي
منشئ القصص المصورة بالذكاء الاصطناعي

تهاني صباح الخير مع صورتك
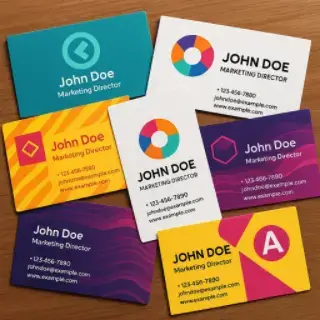
إنشاء بطاقات عمل عبر الإنترنت بالذكاء الاصطناعي

إنشاء فلاير أونلاين بالذكاء الاصطناعي

إنشاء ملصقات عبر الإنترنت بالذكاء الاصطناعي

إنشاء منشورات وسائل التواصل الاجتماعي بالذكاء الاصطناعي

إنشاء إعلانات تجارية بالذكاء الاصطناعي
تصميم إنفوجرافيك أونلاين بالذكاء الاصطناعي
إنشاء شرائح عرض تقديمي عبر الإنترنت بالذكاء الاصطناعي
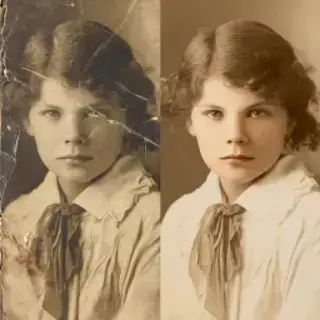
ترميم الصور القديمة أونلاين بالذكاء الاصطناعي

مولد الصور بالذكاء الاصطناعي من صورتك
تغيير العمر أونلاين بالذكاء الاصطناعي

جلسة تصوير بالذكاء الاصطناعي أونلاين من صورتك

إنشاء ملصق من الصورة أونلاين بالذكاء الاصطناعي
مولد أفاتار أونلاين بالذكاء الاصطناعي

مولد صور الزفاف بالذكاء الاصطناعي
تحسين جودة الصور أونلاين بالذكاء الاصطناعي

مولِّد شعار النبالة العائلي بالذكاء الاصطناعي
تصميم داخلي أونلاين بالذكاء الاصطناعي

صانع بطاقات المعايدة بالذكاء الاصطناعي

إنشاء معاينة فيديو عبر الإنترنت بالذكاء الاصطناعي

إنشاء بانر اون لاين بالذكاء الاصطناعي
صانع الشعارات بالذكاء الاصطناعي أونلاين

تصوير المنتجات بالذكاء الاصطناعي

محرر صور بالذكاء الاصطناعي عبر الإنترنت
تصوير المنتجات مع عارضي أزياء بالذكاء الاصطناعي
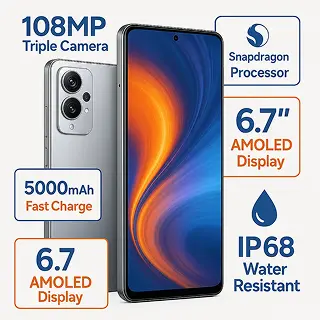
صانع إنفوجرافيك منتجات المتاجر
إنفوجرافيك منتجات أوزون
إنفوجرافيك منتجات Wildberries
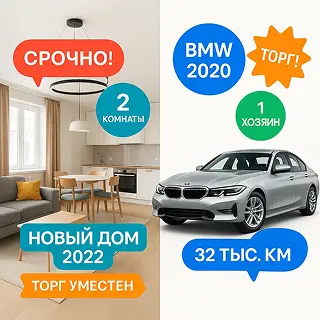
صانع إنفوجرافيك إعلانات Avito
إنفوجرافيك منتجات Yandex Market
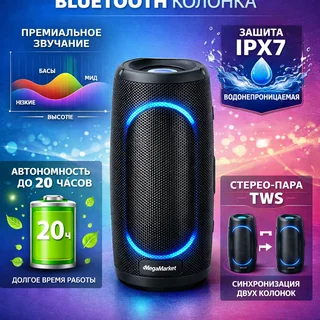
إنفوجرافيك منتجات ميجا ماركت

أداة تكبير الصور بالذكاء الاصطناعي — زيادة الدقة حتى 4x
إزالة الخلفية من الصورة بالذكاء الاصطناعي