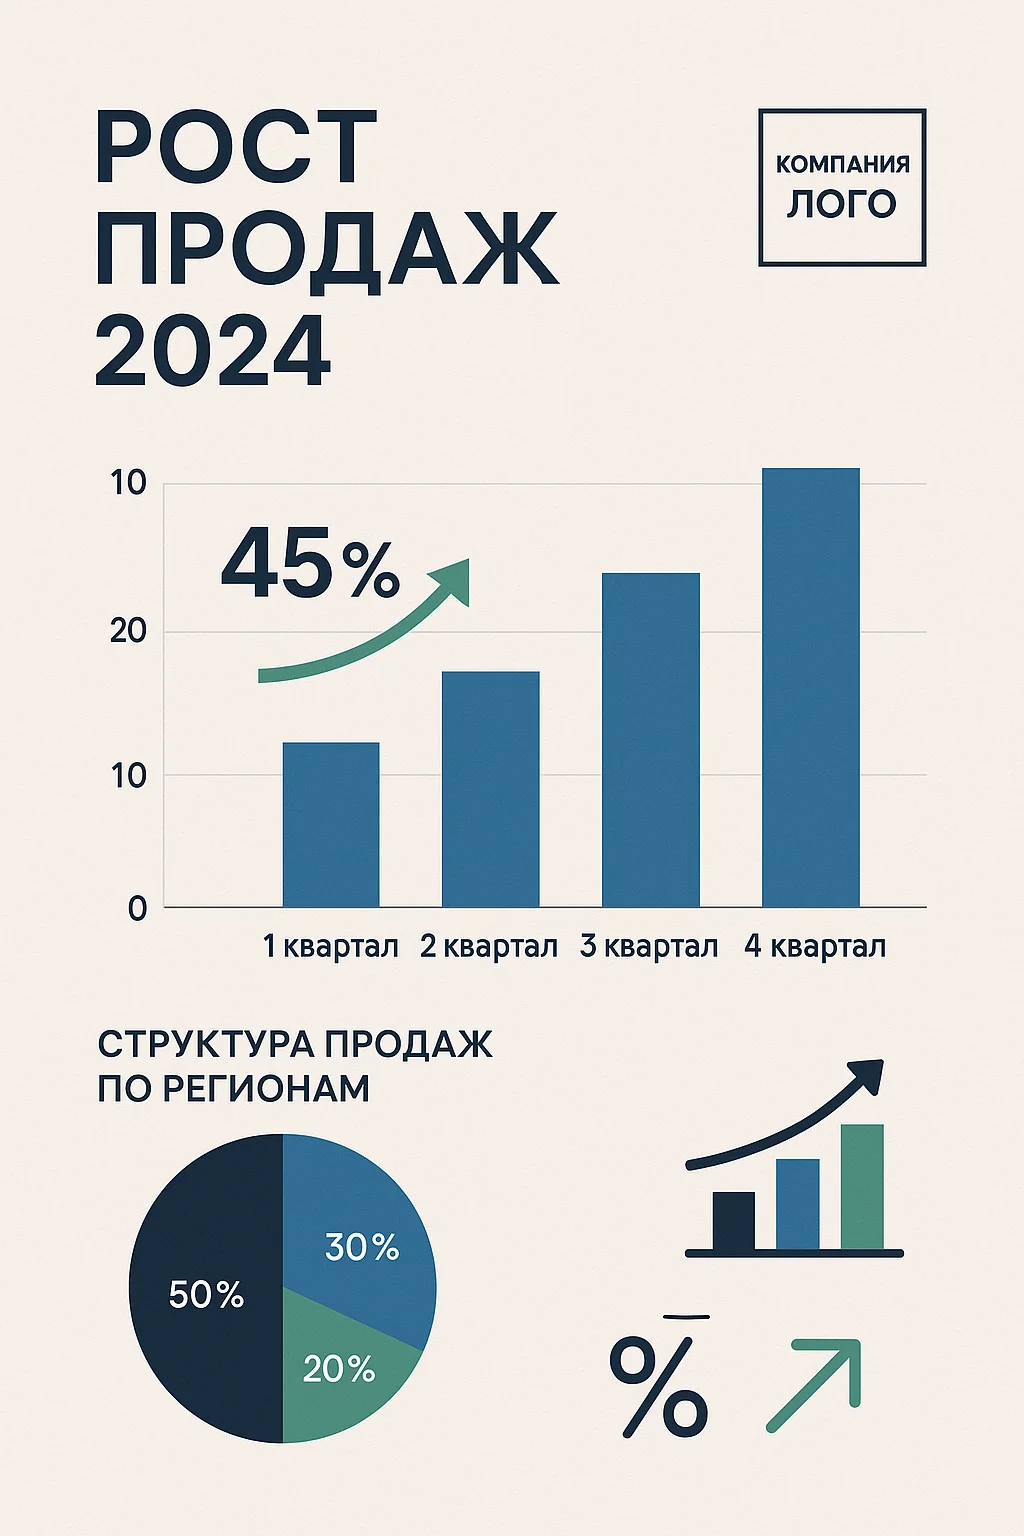
Create Infographics Online with AI
💡 Describe your data or process to visualize (e.g., 'company growth statistics', 'marketing workflow', 'timeline'). Include purpose and style: professional, colorful, or minimalist.
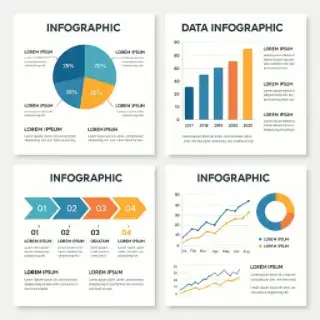
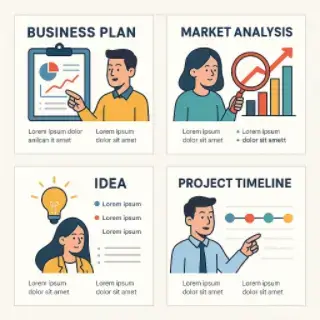
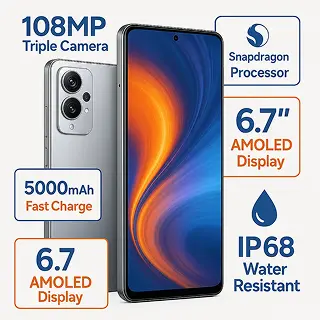
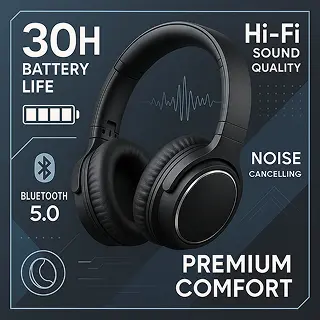
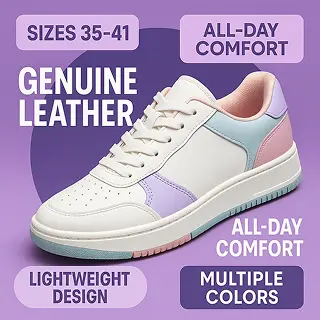
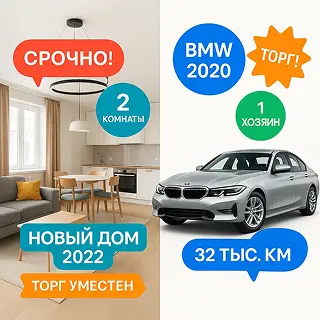
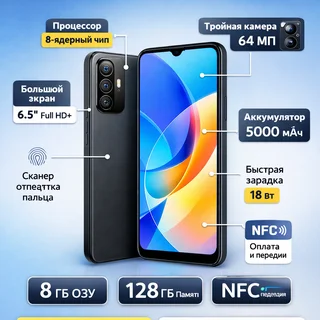
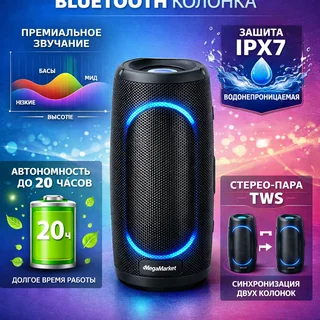
Examples of created images


Infographic Generator for Business, Education, and Marketing
Create infographics online with AI to visualize data, explain processes, and present complex information in engaging visual format. Generate infographic designs for business presentations, marketing, and educational content with charts and graphs.
Key Features:
- Infographic designs for business, education, and marketing presentations
- Multiple styles: data charts, process flows, timelines, and comparison graphics
- Smart data visualization with charts, graphs, icons, and visual hierarchy
- Content integration optimized for clear information presentation
- High-resolution output for presentations, reports, and marketing materials
- Flexible design customization for different platforms and needs
All AI for image generation

Christmas Costume Photo with AI

AI Image Generator

Create March 8 Card Online with AI
Create Goddess Image with AI

February 23 Card Generator with AI

Valentine's Day Romantic Photo Effects with AI

Valentine's Day Card Generator with AI
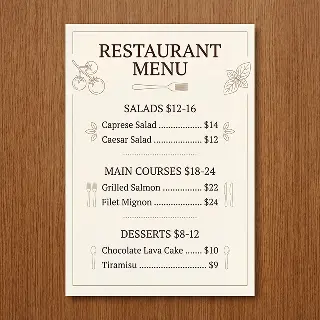
AI Menu and Price List Generator

AI Comic Strip Generator

Good Morning Wishes with Your Photo
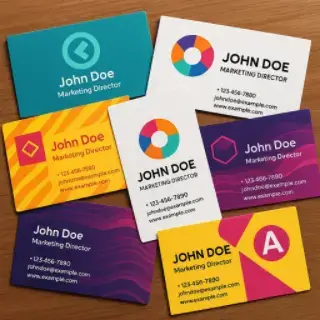
Create Business Cards Online with AI
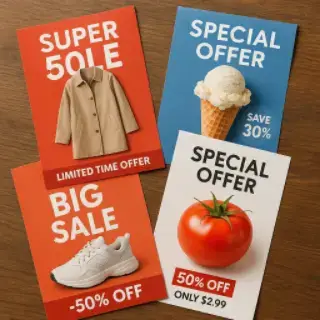
Create Flyers Online with AI
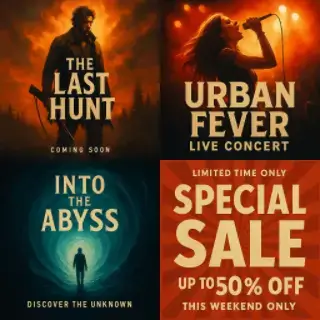
Create Posters Online with AI

Create Social Media Posts with AI
Create Business Announcements with AI
Create Infographics Online with AI
Create Presentation Slides Online with AI
Restore Old Photos Online with AI

AI Photo Generator from Reference
Age Face Online with AI

AI Photoshoot Online from Your Photo

Make Sticker from Photo Online with AI
Avatar Generator Online with AI

AI Wedding Photo Generator
Improve Photo Quality Online with AI

AI Family Coat of Arms Generator

Interior Design Online with AI

Greeting Card Generator with AI

Create Video Preview Online with AI

Create Banner Online with AI
Logo Generator Neural Network

Product Photography with AI

AI Photo Editor Online

Product Photography with AI Models
Marketplace Product Infographic Creator
Ozon Product Infographic
Wildberries Product Infographic
Avito Ad Infographic Creator
Yandex Market Product Infographic
MegaMarket Product Infographic

Improve Photo Quality Online with AI

Remove Background from Photo Online Free