Reporting and analysis diagrams
1 items - Free

Related Categories
Reporting And Analysis 🤔
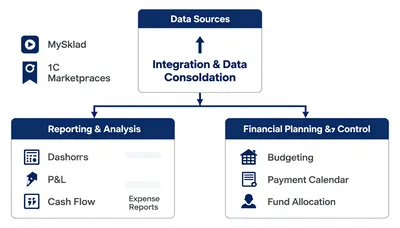
– Flowcharts and diagrams for financial reporting and data analysis processes.
Explore our collection of reporting and analysis diagrams, designed to help you visualize key financial outputs like P&L, cash flow, and expense reports. These flowcharts illustrate how data transforms into actionable insights, perfect for presentations and understanding financial performance. 📈
Free AI Content
Every image here is created by AI and completely free. Use them for websites, social media, print materials, or any creative project. High quality, royalty-free, ready to download.